First time here? Check out the FAQ!
THIS IS A TEST INSTANCE. Feel free to ask and answer questions, but take care to avoid triggering too many notifications.
0

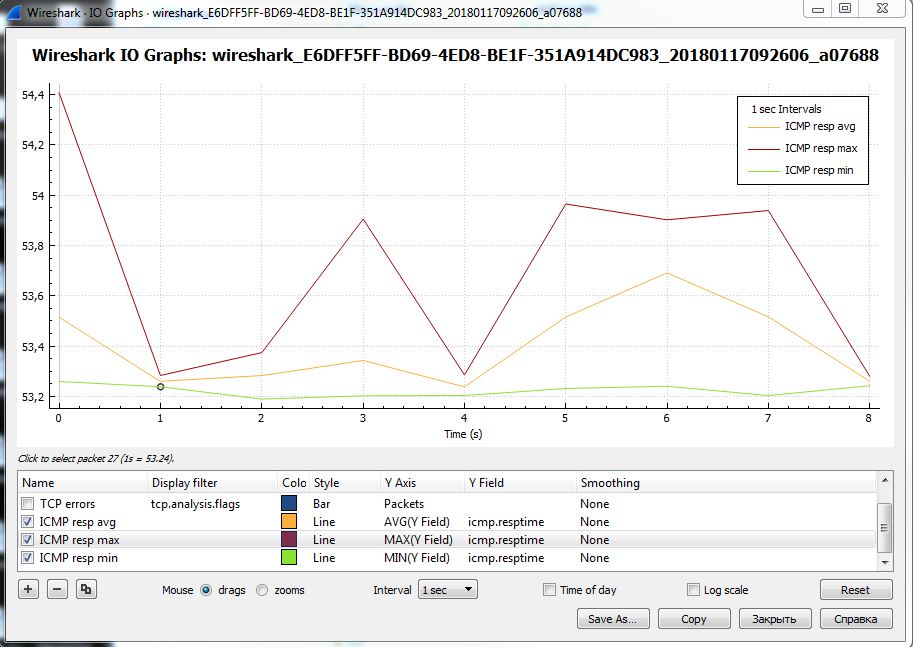
IO Graph: Plot ICMP response time

I have captured ICMP replies and responses, I have set it up so as to display the response time as a column. What I want to know is if it is possible to plot this ICMP response time on IO graph as line.

Can someone give me some hints or tips on doing this. I am using version 2.4.4.

praneet.castelino's avatar
3
praneet.castelino
asked 2018-01-16 23:32:59 +0000
Guy Harris's avatar
19.9k
Guy Harris
updated 2018-01-17 03:00:58 +0000
edit flag offensive 0 remove flag close merge delete

Comments

add a comment see more comments

1 Answer

1

Yes, you can create plot like below on the picture.

Use MIN/AVG/MAX as Y axis and icmp.resptime as Y field.

image description

Packet_vlad's avatar
1.1k
Packet_vlad
answered 2018-01-17 07:32:18 +0000
edit flag offensive 0 remove flag delete link

Comments

Wow, that was straightforward. Thank you so much.

praneet.castelino's avatar praneet.castelino (2018-01-18 02:22:08 +0000) edit
add a comment see more comments

Your Answer

Please start posting anonymously - your entry will be published after you log in or create a new account. This space is reserved only for answers. If you would like to engage in a discussion, please instead post a comment under the question or an answer that you would like to discuss.

Add Answer