
TCP Slow Start Graph
Hi,
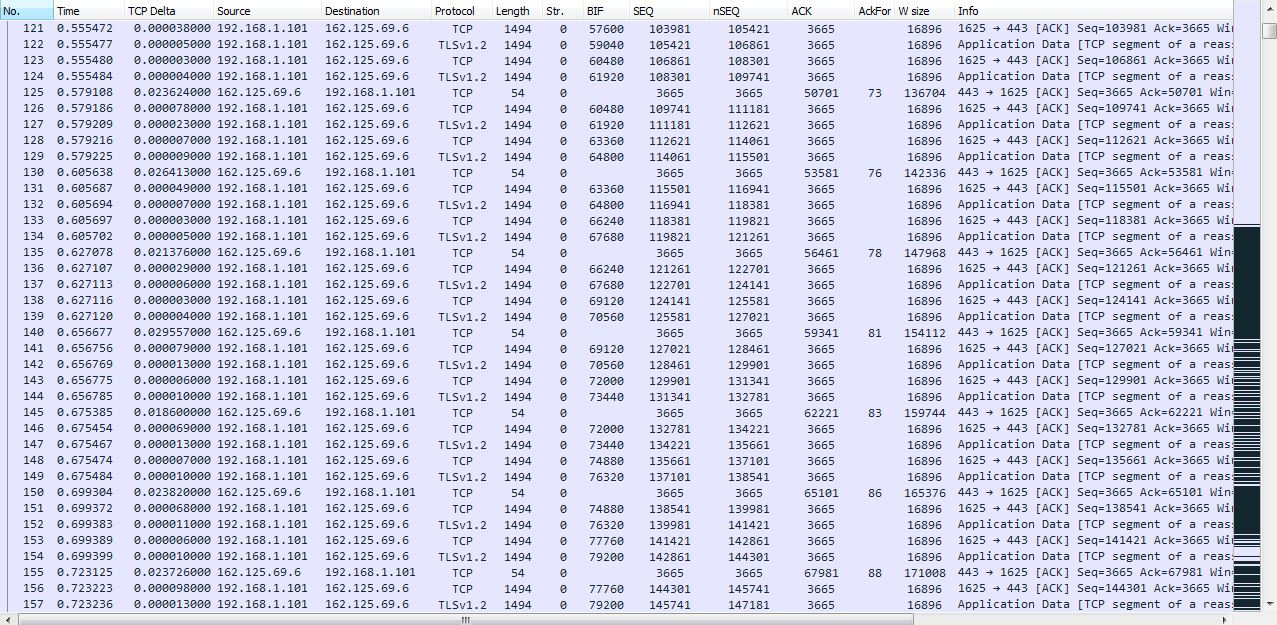
I wanted to make a Graph representation of TCP Slow Start in Wireshark, but I've notice that graph in Statistics->TCP Stream Graph->Time Sequence(Stevens) is a bit strange, what I notice is that I send 4 packet and wait for ACK and than send another 4 packet... and this keep going until loss occur. Only in the begining there is around 20 packets send and then this pattern starts.
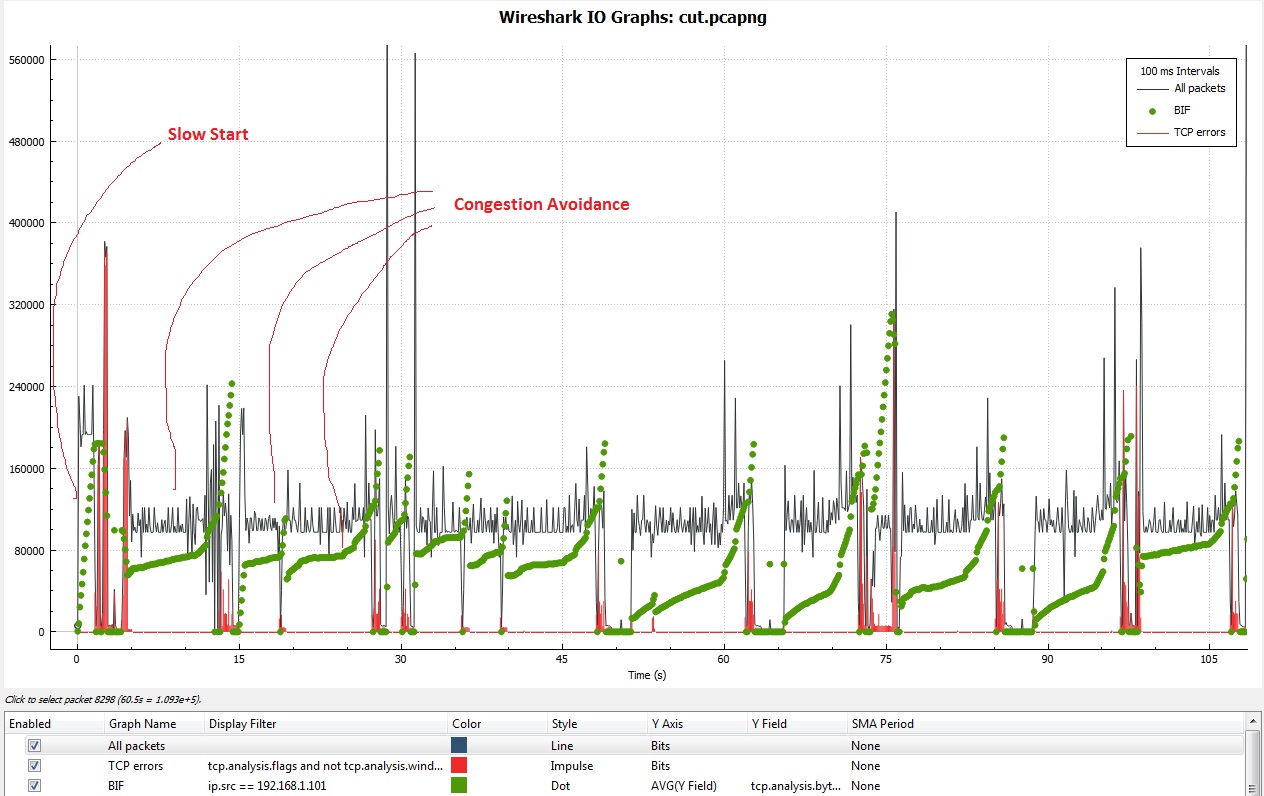
Why there is no Slow Start and Congestion Avoidance in this scenario?
Here is a link of the actual trace, but note that this is just a part of the trace: (I have not enough points to upload a file) https://www.dropbox.com/s/kuluigjobrm1pw3/cut.pcapng?dl=0


Comments
We need more information to be able to help you. It's better to share actual trace, not screenshot. And also please tell the next: capture point location, network environment details, software used to generate traffic.
Packet_vlad I've changed the question in which I added actual trace in the link. This is done for the purpose of traffic analyzing and it's upload of a file to the Dropbox cloud, so I'am the sender and Dropbox is a receiver. I use WiFi internet. Also, now when you have actual trace, can you tell me what causing problem to have so many DUP ACK starting on packet #345 and how to know if some packet is Fast Retransmssion or it's retransmited because of RTO (this situation is on packet #446-it's say Fast Retranssmition but I'm not sure about it)
Well, your trace is not the easiest... I recommend to start with this traces here: https://sharkfesteurope.wireshark.org...
and then go back to your trace. But Keep in mind, that Win7/8 mostly uses CTCP and Linux and Win10 mostly uses Cubic I guess.
It can be clearly seen, that the packet loss has an impact to the performace, due to congestion avoidance mode is entered.